WESTMONT ALUMNI
Welcome Home!
Westmont Alumni like you occupy a wide array of roles in our communities, nation, and around the world. You approach your work and service with excellence, vision and compassion — these characteristics are notable, distinguishing marks of alumni of this community. Today, as when you were a student, Westmont aspires to develop students intellectually, spiritually and relationally.
Stay Connected
The Alumni Office would like to help you stay connected with fellow alumni and your alma mater. Ensure you receive communications for events and reunions. Use the Update Contact form if you have new mailing address or other new contact information.
To learn, To serve, To lead, To connect, To give, To explore.
The Mission of the Westmont Alumni Office is to update, engage, and connect our alumni locally, nationally, and around the globe with the college and their fellow alums through meaningful engagement programs, services, and events to increase awareness, stimulate interest, build loyalty, and philanthropic commitment to the college while holding tightly to the tradition that Westmont has built serving God's kingdom.
Homecoming
Join us for Westmont College's Homecoming, a special event for alumni to reconnect, celebrate, and create lasting memories with fellow graduates. Next Homecoming - October 17-19, 2025.
Help plan or host an event, attend a career fair, join the alumni prayer chain and much more.
Life-Long Learning Opportunities
Westmont the Alumni office is dedicated to continuing to cultivate our alumni through lectures, workshops, and webinars.
Follow Westmont Alumni on Instagram
Follow Westmont College on Instagram for the latest alumni updates, event highlights, and more to stay connected with our vibrant community.
Alumni Mission and Values
Consistent with the core values of the Westmont mission we aim to cultivate the following: | In addition, we aim to engage and connect our alumni by updating them on: |
1. Thoughtful scholars through life-long learning opportunities 2. Grateful servants through opportunities for our alumni to give their time, talent, and treasure 3. Faithful leaders through professional career development opportunities | 1. Innovation and research in the academy, among our students, and faculty publications 2. Alumni updates, prayer requests, and ways to connect 3. Travel opportunities to explore, experience, serve, and grow |
Upcoming 2025 Events
9APRIL | Westmont Wednesday 4/9 - 4/16 | Give this week to the Westmont Fund and help Westmont secure a $100,000 challenge match! |
17OCT | Homecoming 10/17 - 10/19 | Bring the whole family and plan |
17OCT | Westmont Golf Classic 10/17 | Join us for a great day and |
Updates and Stories
Stay connected with Westmont College through alumni updates, events and inspiring stories that showcase the achievements and journeys of our graduates.
Golden Warriors
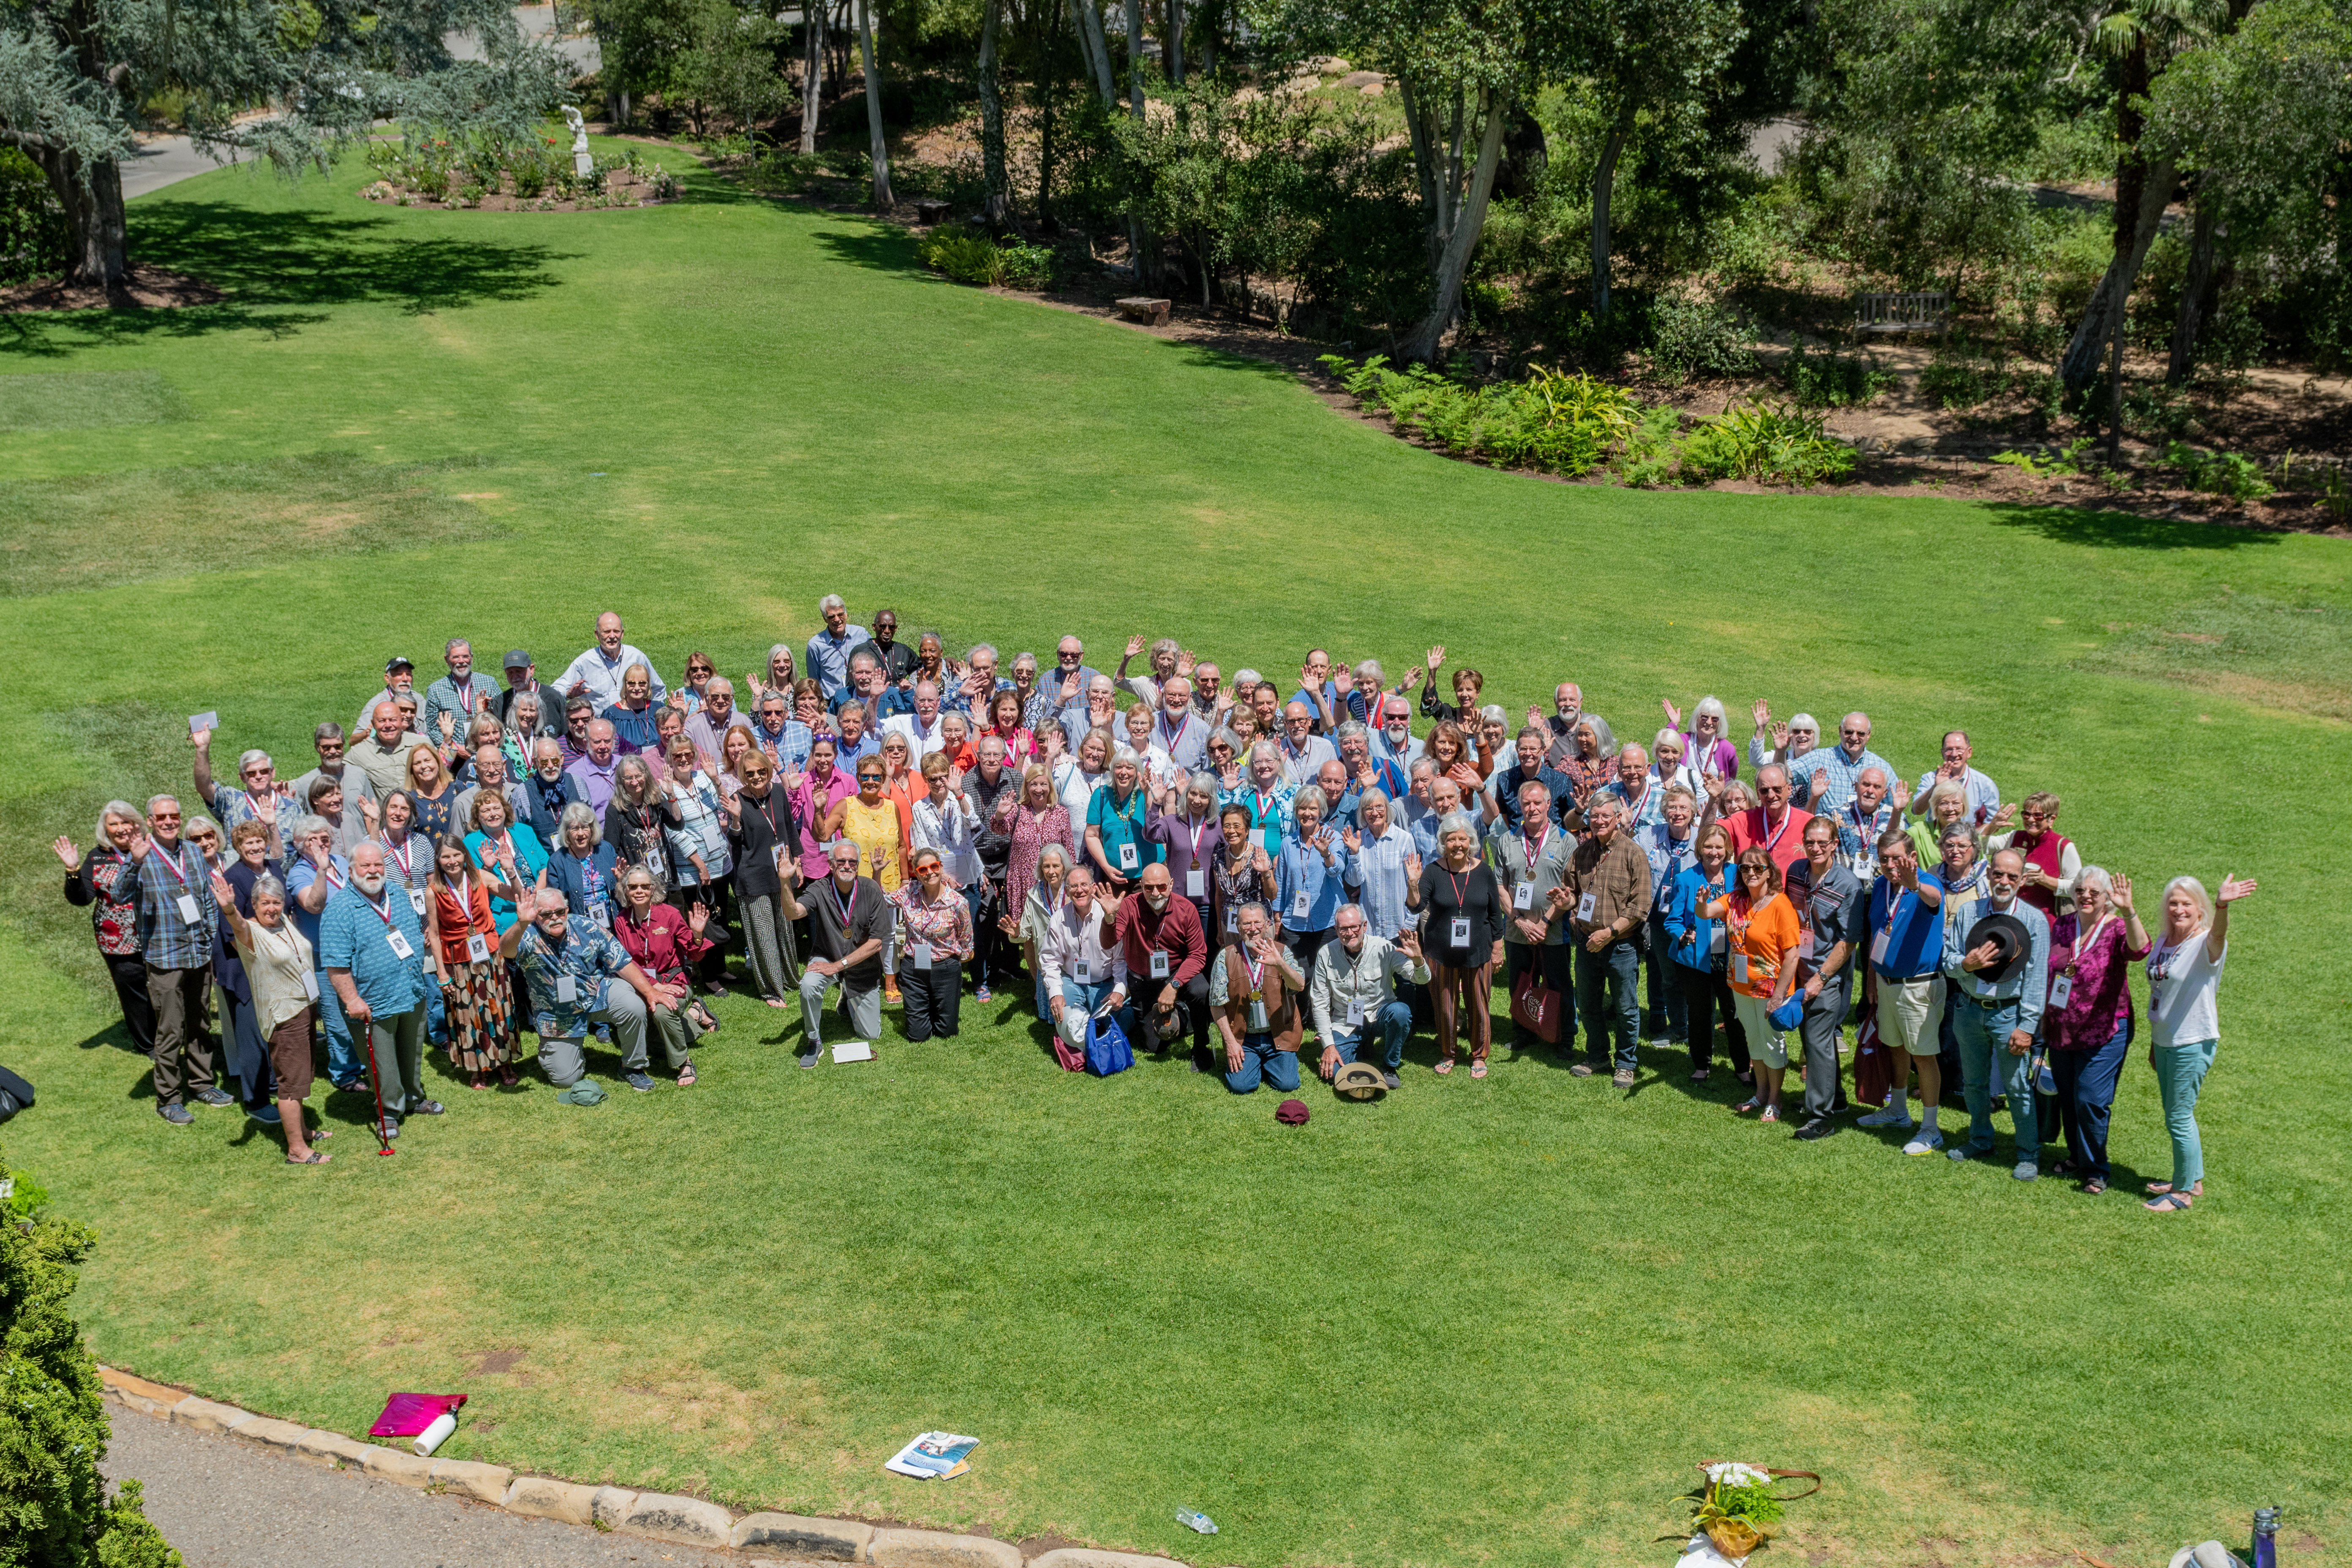
The 50th Reunion weekend is full of activities designed to reconnect you with classmates and your college.

Ben Eastvold (‘01) is the founder and executive director of GLAD Technology, a non-profit dedicated to workforce development for displaced and disadvantaged populations...

John grew up with his younger brother Sam in Wheelers Hill, Victoria, Australia. After finishing High School in the 97th percentile state-wide, John moved to the U.S. to play collegiate tennis in 2010...
Eric Knopf ’04 is the Co-founder and Co-CEO of Webconnex, a leading software company that powers events and fundraising for global brands like Nike, RedBull, Crossfit, Young Life, FCA, and Major League Baseball...

Dr. Lauren Brown-Berchtold ’09. After growing up in a small town in the Central Valley of California, Lauren was wildly lucky to come to Westmont College and have her world expanded...

Ben Eastvold (‘01) is the founder and executive director of GLAD Technology, a non-profit dedicated to workforce development for displaced and disadvantaged populations...

John grew up with his younger brother Sam in Wheelers Hill, Victoria, Australia. After finishing High School in the 97th percentile state-wide, John moved to the U.S. to play collegiate tennis in 2010...
Eric Knopf ’04 is the Co-founder and Co-CEO of Webconnex, a leading software company that powers events and fundraising for global brands like Nike, RedBull, Crossfit, Young Life, FCA, and Major League Baseball...

Dr. Lauren Brown-Berchtold ’09. After growing up in a small town in the Central Valley of California, Lauren was wildly lucky to come to Westmont College and have her world expanded...


